
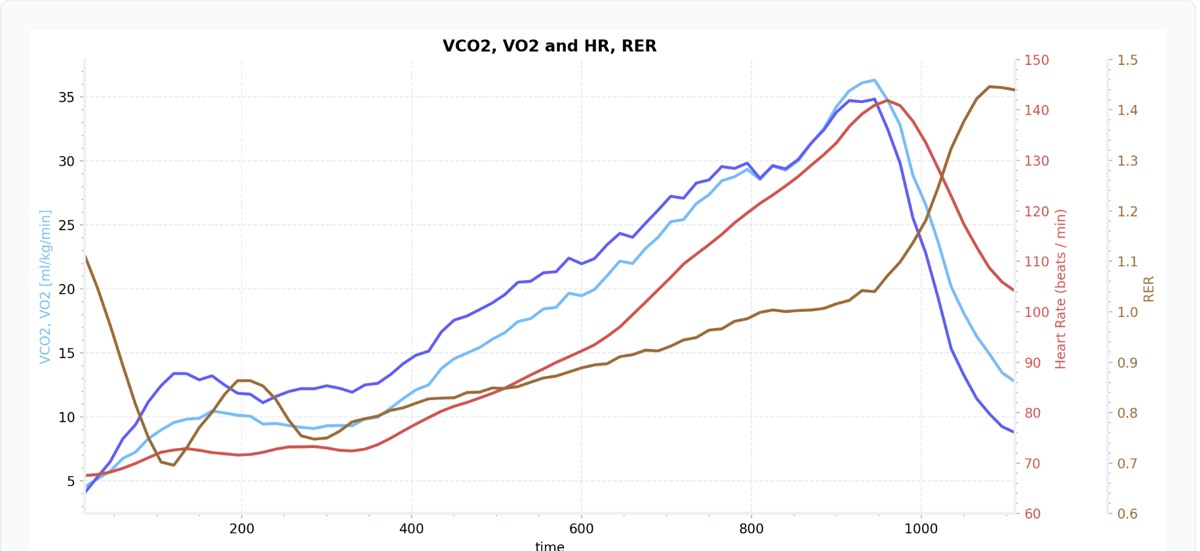
A closer look at the signals behind each assessment. Internal reviewer view.
A complementary service for your lab
Build on the testing you already provide with training-zone analysis, physiological limiter insights and training recommendations, depending on the assessment option selected.
Go beyond a headline score.
Limiter statements connect individual metrics with the physiological patterns identified in a test. Below are three findings from the sample report, including their ratings, each followed by a separate explanation from the glossary.
CARDIOVASCULAR
VO2Pulse trend by zones
A plateau or decline in your VO2Pulse trendline was identified in zone(s) Z3, Z4, Z5, therefore scoring Very Poor.
WHAT THIS METRIC EXPLAINS
Shows how the amount of oxygen used per heartbeat changes as heart rate and exercise intensity increase. A plateau or decline in the VO2Pulse trendline can identify the heart-rate range and training zones in which cardiovascular oxygen delivery is no longer increasing proportionally with exercise demand.
RESPIRATORY
High-intensity VT loss >10%
Your VT declines by more than 10% above 131 bpm, which corresponds to zone(s) Z4, Z5, therefore indicating a respiratory limitation.
WHAT THIS METRIC EXPLAINS
Indicates whether tidal volume decreases by more than 10% at high exercise intensities. A decrease greater than 10% indicates an inability to maintain tidal volume as intensity and breathing frequency increase.
METABOLIC
Early Crossover
Early Crossover / Fat-to-CHO Crossover
You switched over to using mainly carbohydrate (CHO) for energy production at 84 bpm, or 16.67% of your active heart-rate range, therefore scoring Very Poor.
WHAT THIS METRIC EXPLAINS
Identifies the intensity at which carbohydrate (CHO) becomes the predominant fuel source over fat for energy production. An earlier crossover at a lower heart rate or lower percentage of the active heart-rate range indicates earlier reliance on carbohydrate and can represent a metabolic limitation.
Illustrative findings from one sample assessment. Results depend on the individual test; interpretation and recommendations are reviewed before release.
An extensive report. Targeted insight for your client.
The complete PDF report brings together physiological system summaries, detailed limiter statements, training zones, analysis charts and targeted training recommendations. It also includes a glossary and reference training guidelines. Individual recommendations are based on the results of the specific test.
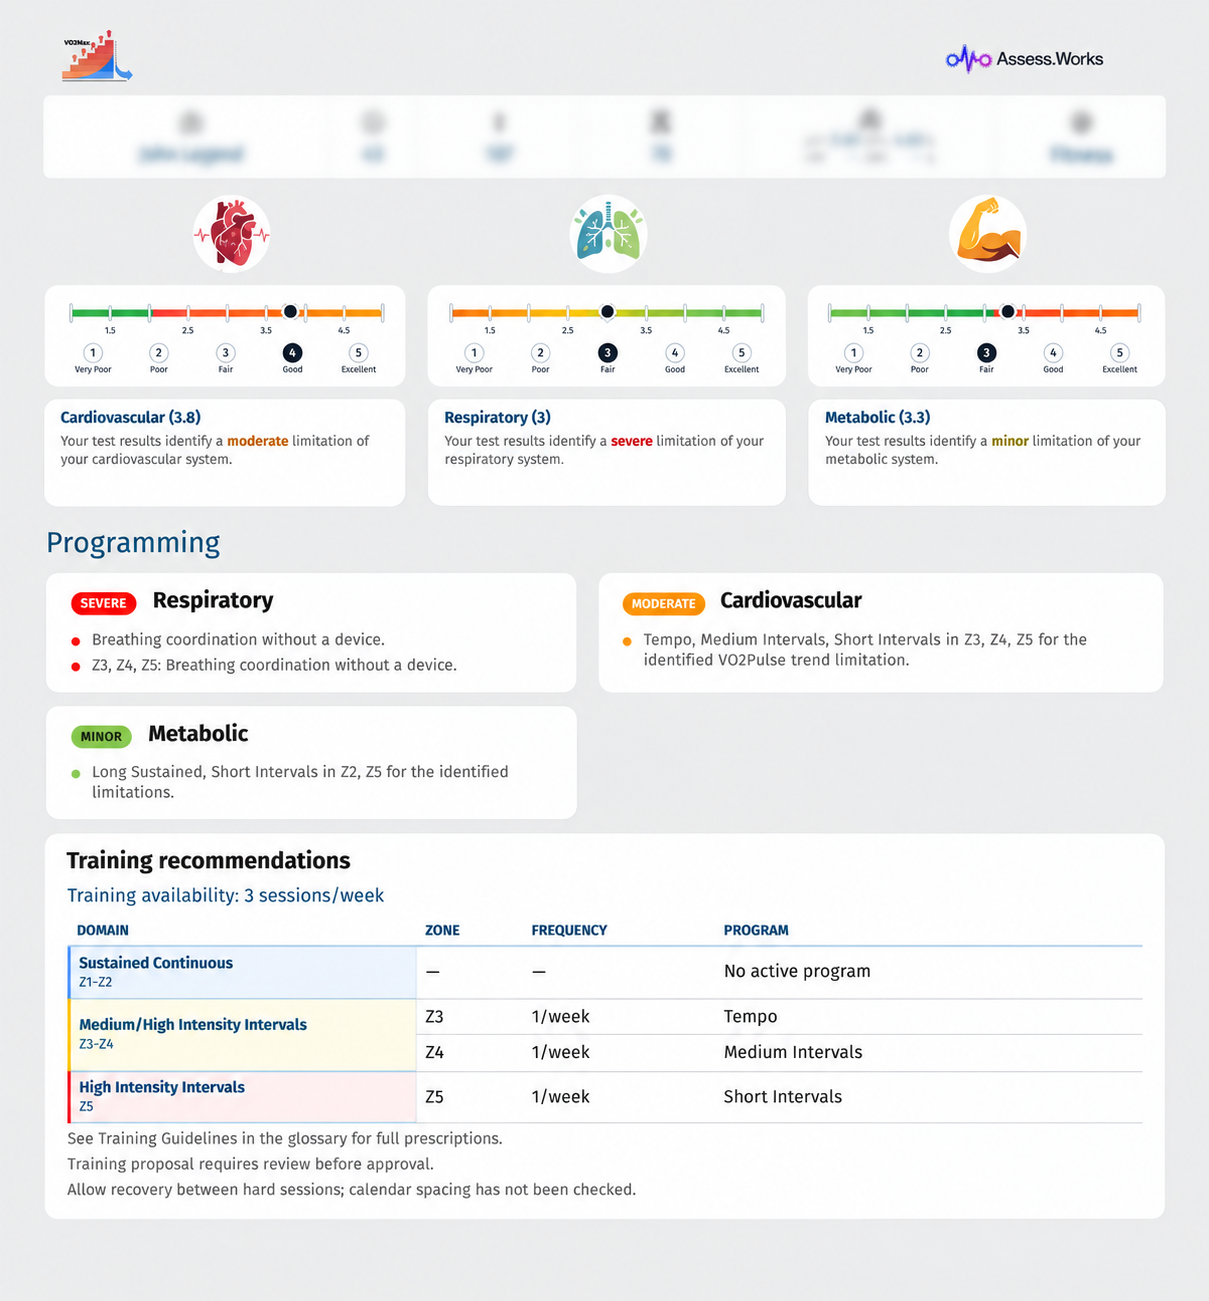
01 / ASSESSMENT SUMMARY — Cardiovascular, respiratory and metabolic findings with follow-on recommendations. Personal details are blurred in this preview.
Specific findings. Explained in context.
Limiter statements connect measured values, their ratings and their relationship to individual zones. The report covers cardiovascular, respiratory and metabolic systems.
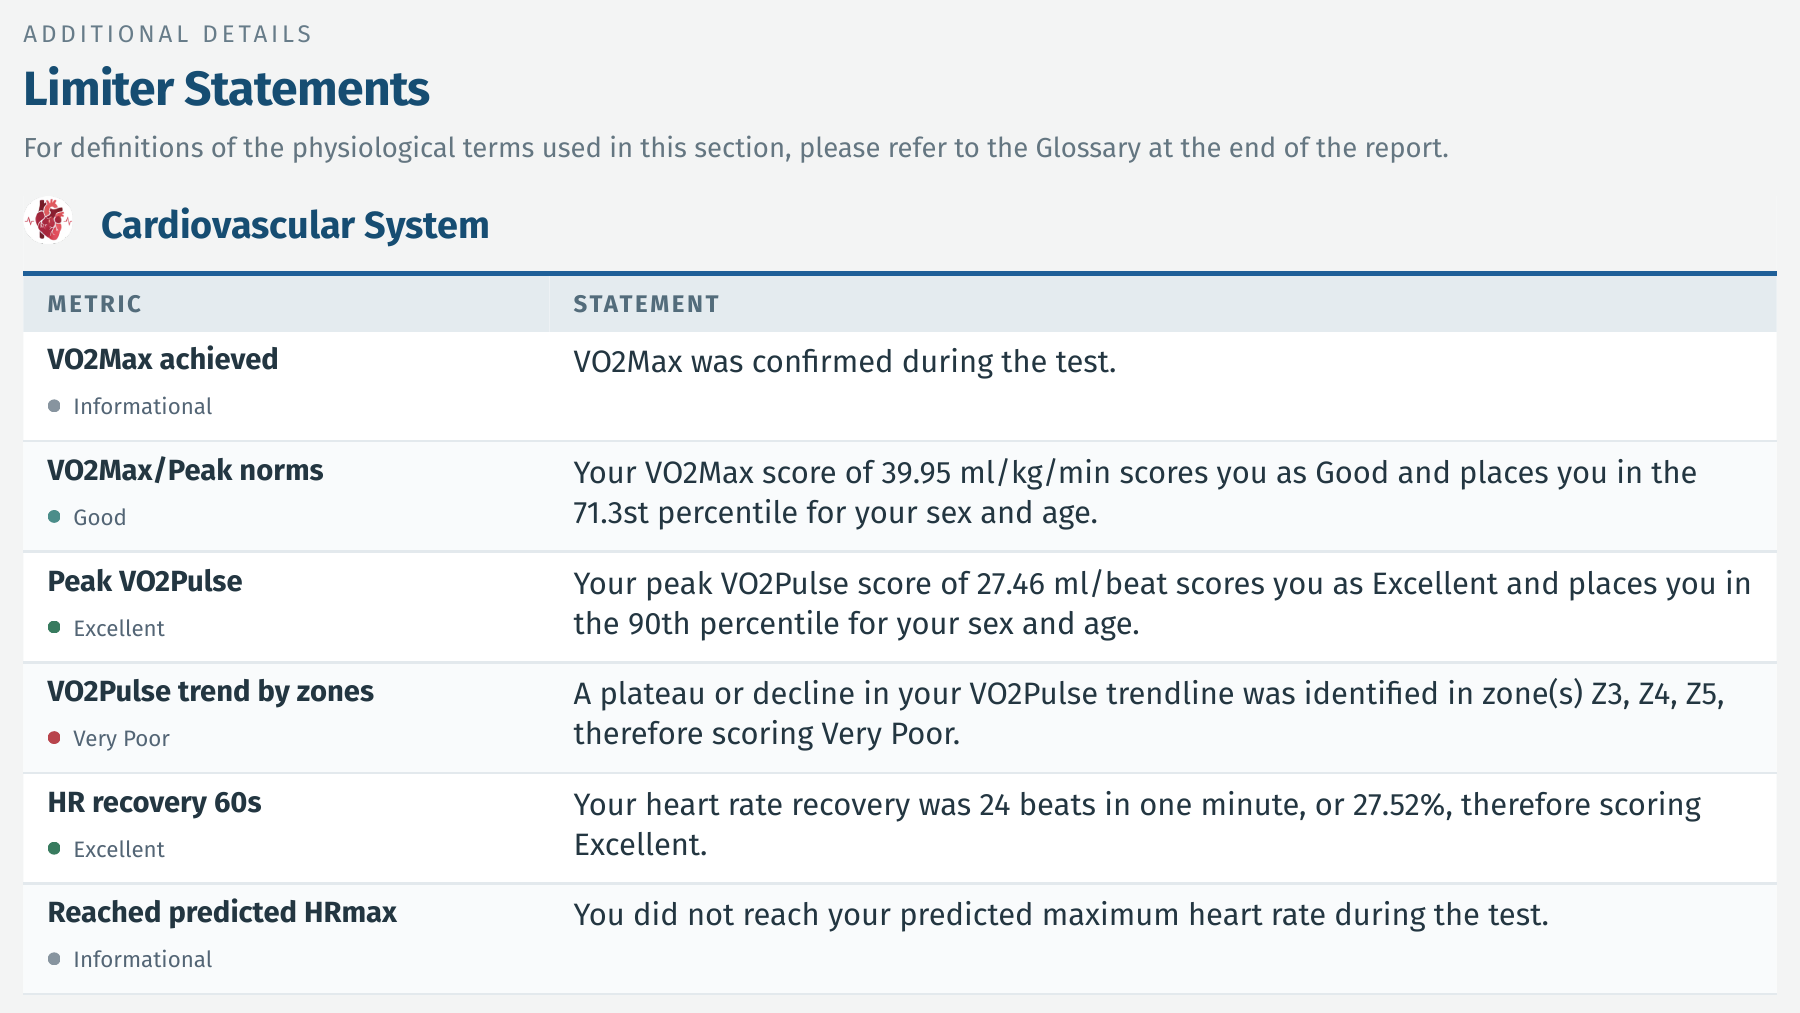
02 / LIMITER STATEMENTS — An excerpt from the cardiovascular section of the detailed findings page.
Training zones in the context of the test.
Intensity domains, threshold values and zones Z1–Z5 are accompanied by explanations of their purpose. Clients gain a practical framework for understanding their training intensity.
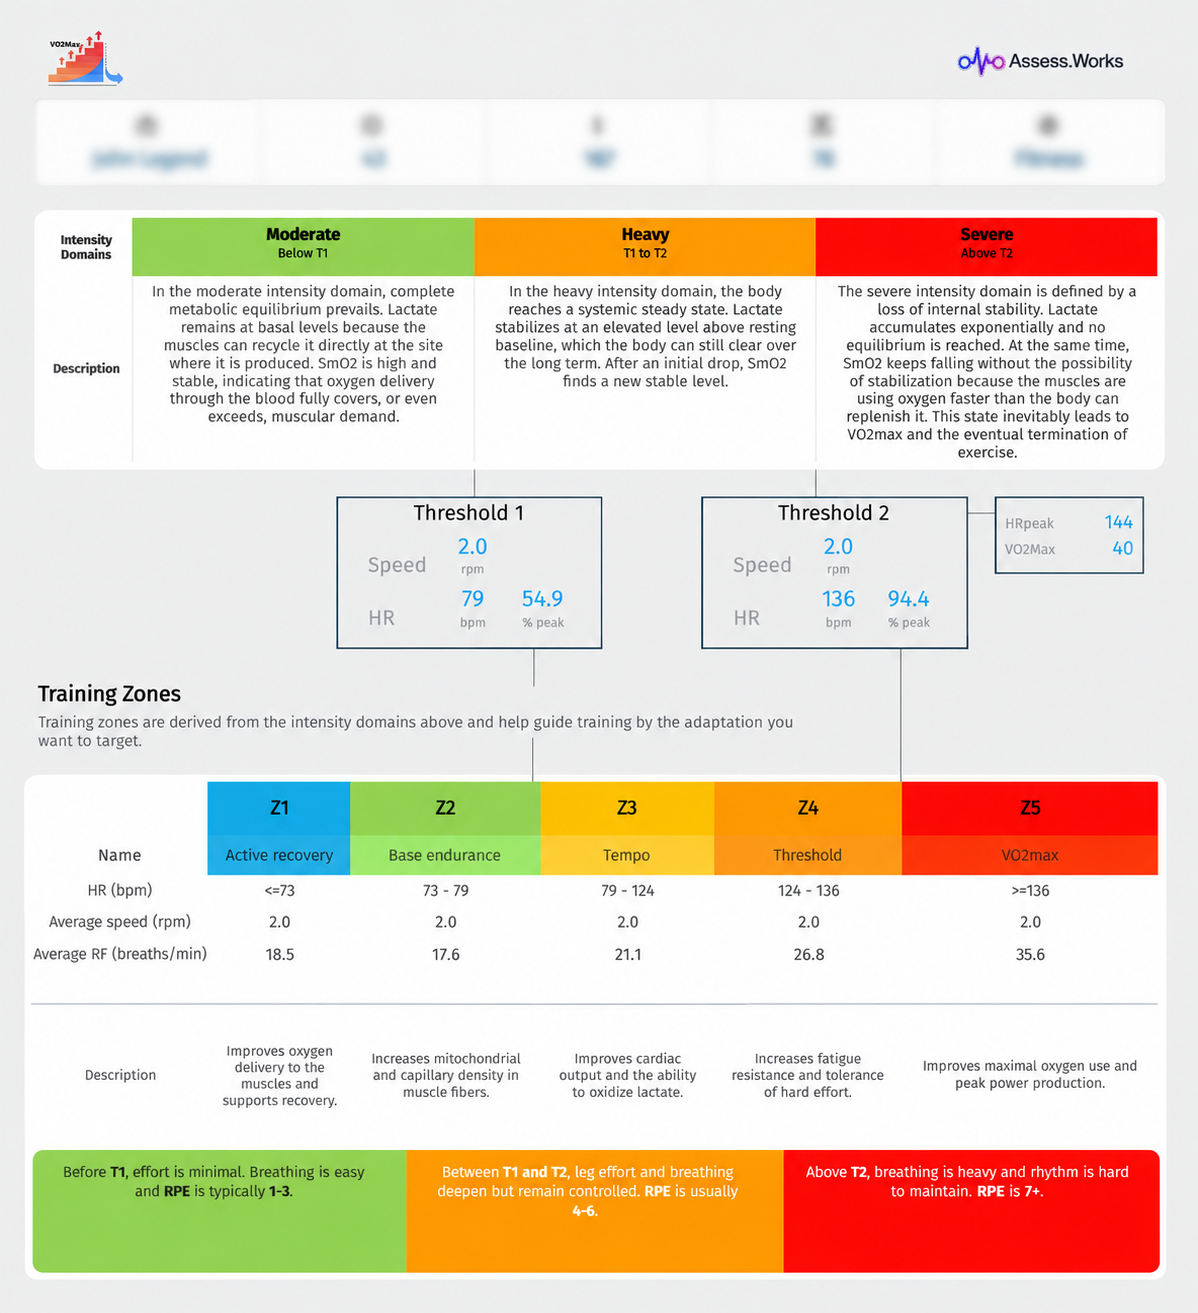
03 / TRAINING ZONES — Thresholds, values and the purpose of each zone in one overview. The findings shown come from one sample test.
A guided route from file to review.
The upload process gathers the test file and the context needed for the selected assessment. Check format and protocol requirements before submitting.

01 / START WITH YOUR EXPORT — A guided submission flow for supported test files.
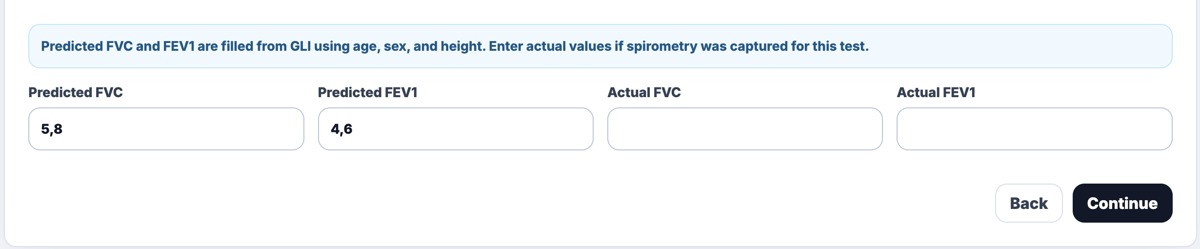
02 / ADD TEST CONTEXT — Where relevant, include measured spirometry alongside predicted values.
Choose the assessment option your client needs: training zones, limiter analysis or a complete assessment with training recommendations. The submitted case then enters the review workflow.
Expert review is part of the process
The PEAK workflow brings together data preparation, evaluation, expert approval and a PDF report. Reviewers can refine zones and review findings before release.
COMPLETE ASSESSMENT
All this. Only €35.
Training zones
Physiological limiter analysis
Training recommendations and a training programme
Expert review and a PDF report
Per complete assessment. Applicable taxes calculated at checkout.